
 |
JPL's Wireless Communication Reference WebsiteChapter: Wireless Channels |
This page describes vehicle to vehicle RF propagation in the 900 MHz band focusing on determining delay spread, probability distribution parameters (in particular, the Rician K factor) and path loss rates. The parameters and results are discussed with implications for the use of RF communication between automobiles in Intelligent Vehicle/Highway Systems (IVHS), in particular for Autonomous Vehicle Control Systems (AVCS).
The results of RF wireless vehicle to vehicle measurements at close range are:

Most literature on RF mobile propagation focuses on transmission between users in automobiles to and from a shared fixed base station. In such scenarios, transmission distances can be quite large, often measured in terms of city blocks. Furthermore, a line of sight (LOS) path between the transmitter and the receiver is not always likely as the base station antenna is often blocked by buildings and other obstacles. The channel is quite different when considering vehicle to vehicle communication. Based on the proposed platoon structures of IVHS designs, it can be assumed that the transmission distances will be quite small compared to the RF transmission cases cited above. In addition, a LOS signal path is virtually guaranteed since any obstacles in the roadway would not only be harmful to RF transmission, but also to driver safety.
Vehicle-to-vehicle data communication will mainly consist of the continuous (routine) exchange of telemetric data such as vehicle status, speed, and acceleration. Interfering signals will be present from vehicles within the platoon and from outside the platoon (from vehicles in other lanes). Vehicles with bumper mounted directional antennas are considered.
The vehicle-to-vehicle radio link can be modelled statistically as a Rician fading channel. The dominant component in the Rician fading channel is likely to be relatively strong compared to the reflected signal (large Rician ![]() -factor), and the delay spread is likely to be relatively small because reflections occur in the immediate vicinity of the transmitter and receiver antenna. The propagation channel is modelled as a dominant component consisting of a direct-line-of-sight wave and a ground reflected wave, a set of early reflected waves, and intersymbol interference caused by excessively delayed waves.
-factor), and the delay spread is likely to be relatively small because reflections occur in the immediate vicinity of the transmitter and receiver antenna. The propagation channel is modelled as a dominant component consisting of a direct-line-of-sight wave and a ground reflected wave, a set of early reflected waves, and intersymbol interference caused by excessively delayed waves.
Models proposed for micro-cellular propagation consider path loss with a transition from free-space propagation to groun wave propagation.
The experiments were primarily concerned with measurement of delay spread, Rician K factor and path loss versus distance; under various scenarios of automobile and antenna positions. The measurements were taken under stationary conditions on a roadway environment with parked cars. The antennas were supported by tripods at a height approximating an automobile's front hood. Two automobiles were parked in tandem at particular separation distance. As this distance was varied (from 6 to 40 feet), the parameters of interest were measured. At each distance, six measurements were taken at slightly different positions (by one half of the carrier wavelength to become uncorrelated) to average out fading.
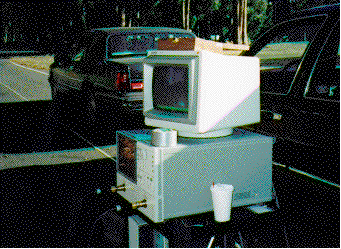
Photo: A network analyzer is a useful tool to characterize a wideband short-range radio channel.
Photo taken at the PATH research lab, Richmond Field station, U.C. Berkeley.
The measurement setup consisted of four components. The components are
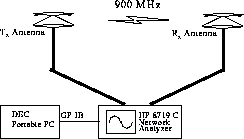
Figure: Propagation Measurement Setup
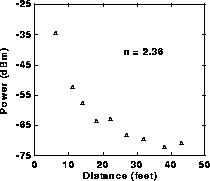
Figure: Path Loss
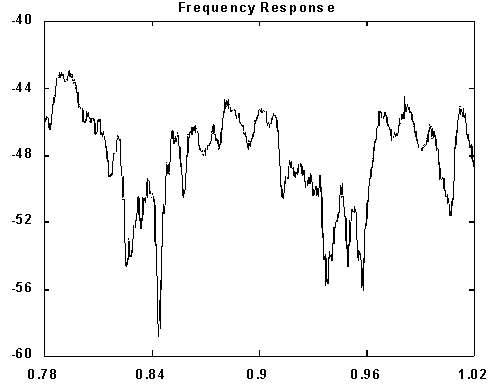
.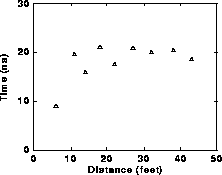
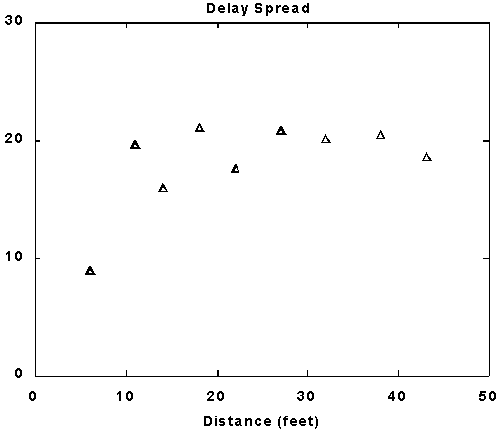
Figure RMS Delay Spread vs. Antenna Separation Distance
The largest measured K factor was 17.6. This value occurred several times. More typical values were in the range of 5.0 to 11.0. Large K factors were anticipated due to the obvious strong LOS signal that is present between the two vehicles. Contrary to anticipation, however, were occasional measured K factors around 1.5 (the lowest was 1.38).
 Printable Documents