 |
JPL's Wireless Communication Reference WebsiteChapter: Data Networks
|
This drift can be interpreted as the average motion towards another (higher or lower) state, when the network is in state m. The network is expected to operate in a state near an equilibrium point, i.e., where the expected drift crosses zero with negative derivative.
With an infinite population of users and a fixed retransmission back-off parameter, the ALOHA system is always unstable, unless capture occurs.

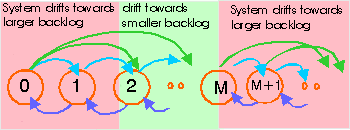
Figure: Markov model for number of packets in backlog.
Backgrounds: Greenish: negative drift; reddish: positive drift
For many ALOHA networks, the state space can be divided into three groups of states
Pake's Lemma says that all states in the system must be transient if the drift is positive for all states beyond a finite M. This lemma thus says that eventually the system will drift away into larger and larger backlog, never to return to states with reasonable small backlog.
Neither Carleial and Hellman nor Kleinrock and Lam considered capture in their papers. Namislo reported drifts, stability and delays for a network with capture. The probabilities of capture were obtained from Monte-Carlo simulation, taking account of path losses; fading and shadowing were not considered. Van der Plas and Linnartz included the effects of Rayleigh fading and shadowing and derived capture probabilities analytically.

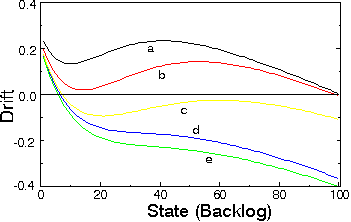
Figure:
Drift for a network of 100 users for a receiver without capture (a), and for a receiver with threshold of 6 dB (z = 4) for
![]() Exercise:
Exercise:
In the above figure, indicate in (or near) which state(s) the network most likely is. answer
Simulations indicate that reducing the probability of retransmission (large back-off time) has a positive effect on the network performance in saturated networks (increasing throughput, decreasing backlog and delay), but a negative effect in stable, unsaturated networks (lower throughput, increasing backlog and delay). In bistable nets, appropriate enlargement of the back-off time can remove bistability, but this measure may not sufficiently relieve the backlog and packet delay: The curve suggests that a relatively drastic reduction of transmission probability may be required. Reducing this in a bistable network can result in a stable network, but with relatively high backlog.
By reducing the probability of retransmission, the effective time each terminal spends in the origination mode also reduces, which indirectly resulted in a low input traffic load. This would suggest that mobile channels might as well be managed by directly controlling the input traffic, for instance by limiting the number of terminals that are allowed to be signed on simultaneously.
Influence of near-far effect
Packet transmissions considered in many theoretical studies
are assumed to be uniformly distributed over the coverage area. In this event, the probability of correct reception of one out of n colliding packets has some non-zero limit for large n.
As an more realistic alternative, the log-normal spatial distribution can be considered, which assumes log-normally
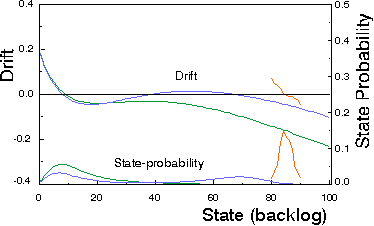
distributed mean powers. This allows more realistic modelling of the packet traffic very close to the receiver. The true uniform distribution is compared with a log-normal distribution. The state probability and average drift are depicted for a receiver threshold of z = 10 (10 dB).
The traffic parameters are :
The simulation further takes into account that most retransmissions originate from the boundary of the service area. Initially the software simulation program randomly distributes 100 terminals over the area 0 < r < 1 and estimates the corresponding local-mean powers for every terminal according to plane earth loss ("40 log d"). Shadowing is ignored in this experiment .
All terminal states are modeled as a tri-state variable. In the O state, the program performs a random experiment to simulate generation of a packet with probability P0. In the R state, permission for retransmission of a previously collided packet is granted with probability Pr. In both cases, the terminal enters the T state where the transmission and (multipath) propagation of a packet is simulated by the random generation of an instantaneous received power, according to an exponential distribution. By accounting for all the received interference packets, the program determines whether any of the colliding packets is strong enough to capture the receiver.
Results indicates that both the uniform and the log-normal spatial distributions lead to optimistic estimates of the network performance, compared to the simulations.

Figure: Expected drift and state probability for a slotted ALOHA network with 100 users and a receiver threshold of z = 10, according to a uniform distribution, a comparable log-normal spatial distribution
and a simulation. Probability of a new packet generation P0 = 0.0055. Probability of retransmission Pr = 0.08.
Because of capture probabilities decreasing with distance, the average time a terminal is in the retransmission mode increases with distance. Since P0 < Pr , the traffic offered per unit of area increases with distance. This has a disadvantageous influence on the network performance: colliding signals are more often received from far away and hence more with nearly equal (low) powers. Consequently, the probability that the power of one of these signals sufficiently exceeds the joint interference is relatively low.