 |
JPL's Wireless Communication Reference WebsiteChapter: Data Networks |
 We address a system with cellular frequency reuse and
downlink transmission bursty packet traffic. It turns out that the typical
frequency reuse strategy used for telephone systems is not optimal for such packet data traffic.
Protocols supporting of data services can accept the risk of harmful collisions between coinciding packets, in return for not having to schedule their bursty accesses very strictly or to defer transmission for a long time. Packet protocols are designed to repair any harmful interference between packets simply by retransmission.
|
The concept described on this page closely resembles the vision of Justin Chang of AT&T Research Labs. Initially he explains the goals of EDGE, as on GPRS and GSM. | ||
|
Frequency reuse in existing networks has been optimized
for voice, by defining an outage probility. For data, higher throughput
can obtained by redefining the reuse policy.
|
References: | |
|
Is frequency reuse used properly in multi-media networks?
|

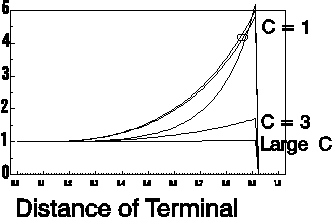
| Figure: Number attempts versus
distance between terminal and base station, for cluster
sizes C = 1, 3 and infinite. Pathloss: 40 log d (plane earth); Rayleigh fading; Shadowing of 6 dB, assumed to be independent for each transmission attempt. Receiver threshold 6 dB. Results have been obtained using the Laplace method to evaluate outage probabilities. Curves for C = 1:
|
The above figure compares the number transmission attempts needed in a Base Station to Mobile link for various cluster sizes C, assuming that co-channel cells are continuously active. In reality, other cells will be idle for a significant portion of time, allowing the base station of our considered cell to transmit without interference. Thus, for a given probability of cochannel cells being active, one can find the expected number of required transmission attempts, or equivalently, the transmission service time of a packet. Moreover, the distribution of service time, conditional on terminal location of unconditional, can be modelled and computed.
An M/G/1 queueing model for the base station allows us to consider
                   l2 ES2
     D = ES +    ----------
                 2(1 - lES)
Here, l is the arrival rate of messages into the queue.
In a stable system this must equal the successful throughput.
S denotes the services time, and E is the expectation operator, so ES
is the average service time, and ES2 is the second moment of the service time. In our model of a downlink, the service time is a random variable due to retransmission traffic. For a mobile at a given range from the base station, the number of (re-) transmissions is a geometrically
distributed random variable, the mean value of
is plotted in the above figure.
ES and ES2 can be computed by combining the effect of a random position in the cell (distance between 0 and cell radius R) with a geometric number of attempts.
For the number of transmission attempts M, we find
           2     R    r dr
     EM =  --   INT   ----
           R2   0     Q(r)
and
             1     R    1 - Q(r)
     EM2 =  ---   INT   --------  2p rdr
            pR2   0      Q2(r)
Here Q(r) denotes the probability of a successful transmission.
The service time S is proportional to M and proportional to cluster size C:
In a system with C different frequencies, each cell only has access
to a fraction 1/C of the total spectrum resources, so the transmission bandwidth and
bit rate can only be 1/C times the rate in a channel of full bandwidth.Furthermore, in a cell that has access to a large transmit bandwidth, the base station will be idle most of the time. This is reduces interference to other cells.

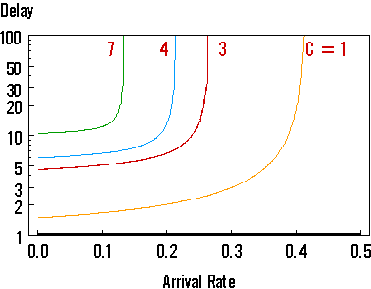
| Figure: Queueing delay versus arrival rate for various cluster sizes. |
Although with C = 1, more retransmissions will be needed, any system with C = 1 has significantly more bandwidth per cell. Hence the total delay time (including retransmissions) is likely to be smaller.