 |
JPL's Wireless Communication Reference WebsiteChapter: Wireless Channels
|
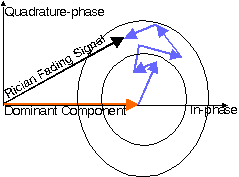
 In Rician fading, a strong dominant component is present. Similar to the case of Rayleigh fading,
the in-phase and quadrature phase component of the received signal are i.i.d.
jointly Gaussian random variables.
However, in Rician fading the mean value of (at least) one component
is non-zero due to a deterministic strong wave.
![]()
Here, ![]() is the local-mean scattered power and
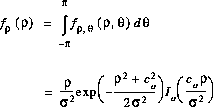
is the local-mean scattered power and ![]() is the power of the dominant component. The pdf of the amplitude is found from the integral
is the power of the dominant component. The pdf of the amplitude is found from the integral
 ,
,
where ![]() is the modified Bessel function of the first kind and zero order, defined as
is the modified Bessel function of the first kind and zero order, defined as
![]()
 Hint for Numerical evaluation
 function I0(z){
  if (z > 4)
    return Math.exp(z)/Math.sqrt(2*Math.PI*z)*(1+1/(8*z));
    else
    return 1 + z*z/4 + Math.pow(z,4)/64  + Math.pow(z,6)/2304 +   Math.pow(z,8)/147456;
}
![]()
The total local-mean power is the sum of the power in the line-of-sight and the local-mean scattered power.
![]() .
.
The local-mean scattered power equals s2 = ![]() /(K + 1).
The amplitude of the line-of-sight is C =
Ö( 2K
/(K + 1).
The amplitude of the line-of-sight is C =
Ö( 2K![]() /(K + 1) )
/(K + 1) )
 Conversion
![]()
From the pdf of signal amplitude, one can derive the pdf of signal power using the standard mathematical methods. In particular, we need p = r2/2, so dp = r dr. This is used in fp(p) dp = fr(r) dr
            (1+K)e-K         (1+K)                     p
    fp (p) = --------  exp(- ---- p ) I0 (Ö (4K(1+K) ----) )


 Figure: Probability Density Function of received signal power
for various Rician K-factors. The total local mean power (scattered plus line-of-sight) = 1. Figure: Probability Density Function of received signal power
for various Rician K-factors. The total local mean power (scattered plus line-of-sight) = 1.
Source code: PlotRice.java Credits: The Java curves are computed using the Ptolemy Plot package, authored by Edward Lee et al. © University of California, Berkeley. |
 Evaluate the Rician distribution
Outage probability = (1 + K) exp(-K) h-1
where the fade margin h is defined as the local-mean power devided by the threshold pn.
Hint: Use only the first term of the approximation for the Bessel function given on this page. Then integrate the PDF for powers from zero to pn.
Compare this with the expression for the special case of Rayleigh fading (K = 0). What is different? The level, the slope or both level and slope of the curve of probability versus h?