
 |
JPL's Wireless Communication Reference WebsiteChapter: Wireless Channels
|
As will be discussed in more detail below, the measured rms delay spreads ranged from 16 - 52 ns. Delay spread increased with transmitter/receiver distance as well as room dimensions. The delay spread in the hallway was relatively constant when compared to the other rooms. The path loss drop off rates were 1.72 in the hallway, 1.99 in room 307 and 2.18 in room 550. Significant signal transmission occurs through the walls. For the U.C. Berkeley Cory Hall building, this suggests that walls can not be used as natural cell boundaries.
More about the effect of changing antenna positions: rate of fading, diversity
Figure: Typical measured indoor impulse response
Essentially, the instantaneous impulse responses were combined to obtain the delay profile, or a probability density function (pdf) of various values of excess delay. Here, excess delay is defined the delay in the instantaneous impulse response after subtracting off the delay of the fastest arriving signal component. From this pdf, one can numerically calculate the mean excess delay and the rms delay spread of this pdf. In determining delay spread, one weights the delay with the power level associated with this delay.
The first point to note is that the rms value generally increases with distance between transmitter and receiver. Heuristically this can be explained by the idea that with greater distance, the long-distanced reflections are relatively stronger (compared to the line-of-sight) to their contribution to an increased delay spread is more significant.
Note further that the smallest delay spreads are found in the hallway. The width of the hallway was less than 8 feet as compared to over 12 feet for Room 400 well above 20 feet for the other two rooms. These small dimensions in conjunction with the relative absence of obstacles resulted in a delay spread that was essentially independent of distance. Heuristically we can say that increasing the distance did not result in a greater number of multipath reflections. Consistent with the above is the fact that delay spread is directly proportional to the general dimensions of the rooms within which measurements were taken. Thus, Room 550 produced the greatest delay spreads and likewise Room 550 was the largest room.
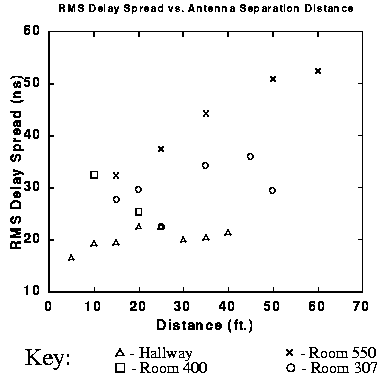
FIGURE: RMS Delay Spread vs. Antenna Separation Distance
The Figures below exhibit instantaneous impulse responses from measurements in Room 550. These two figures serve as examples of different respective arrival times for the first and the strongest received signal component arrival times. Measurements have been taken at a 35 foot (11 meter) received-transmit separation distance.
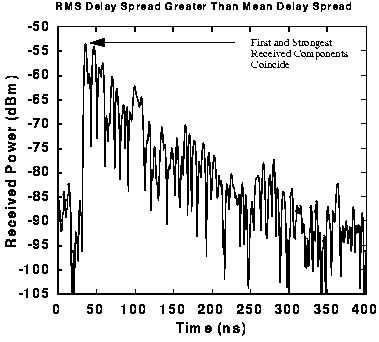
FIGURE: Impulse Response in Room 550
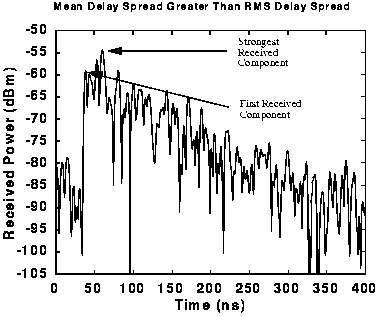
FIGURE: Impulse Response in Room 550
     n
p = d,
where d represents distance. In the case of ideal free space
loss, n = 2. We call n the path loss rate.
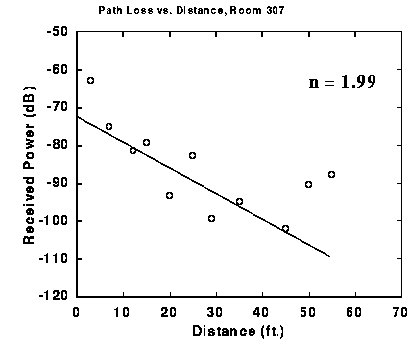
FIGURE: Path loss versus distance
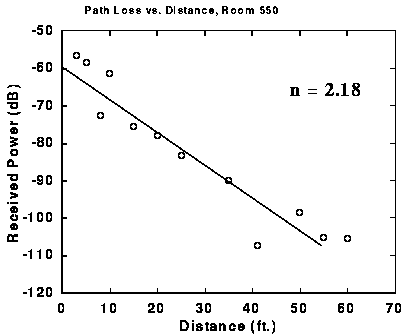
FIGURE: Pathloss
As the three graphs show, signal strength drops off faster as dimensions of the room increase. In the case of the hallway, the drop off rate was significantly smaller than 2.0 which is the value for free space loss. The explanation for this could be that the hallway acts as a waveguide given its small width. Note that the received power levels in these Figures are in dB (not in dBm) and are with respect to +10 dBm. To obtain absolute power values in the figure, 10 dB must be added to each component. Note further that n is based on log-log data although the graphs shown are log-linear.
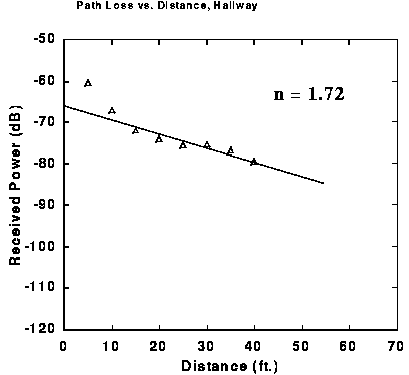
FIGURE: Pathloss
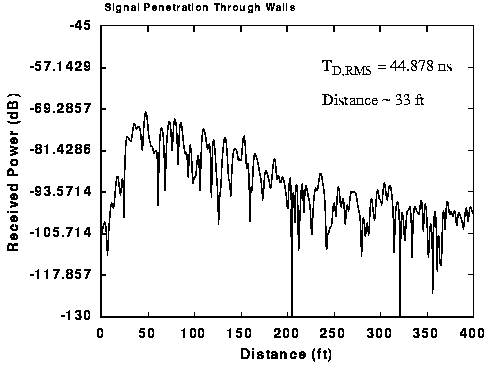
FIGURE: Signal Penetration Through Walls
The instantaneous impulse response was taken on the 5th floor of Cory Hall. The transmitter was located in room 550 and the receiver was located in the corridor near the freight elevator. Again, the received powers shown are with respect to +10 dBm so that absolute values can be obtained by adding 10 to magnitudes shown. Clearly the received signal strength through the wall is significant and shows that some of the walls in Cory Hall can not serve as cell boundaries. Note that certain walls in Cory consist of different materials than those on the 5th floor. Most notably, room 473 was once an anechoic chamber and is essentially a metal cage. With these exceptions, we reiterate that most walls in Cory can not serve as cell boundaries.