JPL's Wireless Communication Reference WebsiteChapter:
Analog and Digital Transmission
|
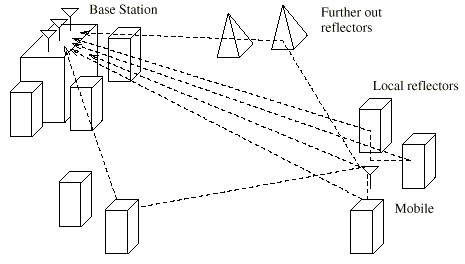
There are many different types of channel models appropriate to different radio systems and scenarios, but here a channel model will be developed for a large CDMA macro-cell operating in an urban environment. For simplicity, the case of a single antenna receiver will be initially considered: the results will subsequently be generalized for an antenna array receiver in the next section. The radio channel can be characterized via its impulse response. This provides an indication of the severity of multipath propagation, which occurs due to multiple copies of the signal arriving at the receiver with different amplitudes and time delays.
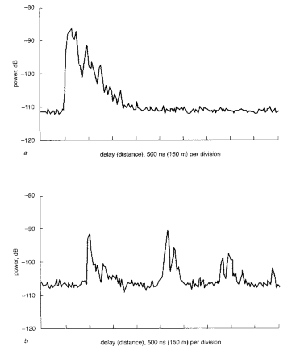
| Two examples of typical delay spreads. Path loss (dB) versus excess time delay. |
In dense urban areas, there are many buildings and obstacles that give rise to multipath propagation and the range of times of arrival can be significant. The COST-207 model is one widely used method of characterizing the mobile channel. It is often assumed that each channel tap is wide-sense-stationary for the mobile moving over short distances, up to a few tens of carrier wavelengths. This means that the signal variation with location is due purely to phase changes in a set of independent multipath components which cannot be separated in time. The resolvable channel taps are assumed to be uncorrelated as each tap arises due to contributions from different multipath scatterers. The exact distributions of the signal envelopes are a function of the signal bandwidth but, for a narrow band CDMA system, two distributions are often pro-number posed. If a dominant line of sight (LOS) path exists between the transmitter and receiver, the first received signal component will follow a Rician distribution. However, in urban areas, this is often not true: each channel tap consists of a number of independent multipath scatterers with the same probability distribution. Applying the central limit theorem, the received signal envelope statistics can be assumed to follow the Rayleigh distribution. As the mobile moves, the signal strength regularly changes by 20-30 dB; a phenomenon often called fading.
 |
Over a longer period of time, the average (averaged over the Rician or Rayleigh fading) received signal power levels vary according to shadowing effects, which have been found to follow a log-normal distribution. The standard deviations quoted for this vary between 4-12 dB according to the type of environment encountered. In addition, path loss occurs: the average received power varies inversely with the transmitter-receiver distance r, raised to the power n. The value of n varies widely, but for urban areas its value is often approximated as 4. In this analysis, it will be assumed that power control can adequately compensate for these effects but that it is unable to compensate for Rayleigh fading: this is somewhat pessimistic compared to the quoted results for IS-95 power control systems. The overall time variation of the received signal and the individual channel taps depends on the motion of the mobile. As the mobile moves through spatial locations with different field strengths, each multipath component of the received signal is subject to a Doppler shift in frequency. For a CDMA signal not subject to data modulation, calculating the power spectrum of each channel tap shows the distribution of Doppler frequencies for the constituent multipaths. The maximum Doppler frequency is proportional to the vehicle speed v.
There are two different forms of multipath scattering, according to the excess time delay of the given channel tap:
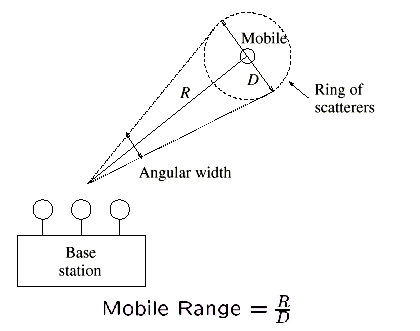 |
The Doppler spectrum is still determined by the angle spread of multipath waves departing from the mobile antenna, thus with a 360 degree spread.


![]()