
 |
JPL's Wireless Communication Reference WebsiteChapter: Wireless Channels
|
| Figure: the basic idea behind the scatter function is that it plots the expected power per Doppler shift and per excess delay bin. Sometimes, angle of incidence (bearing) is plotted in stead of the Doppler shift. |
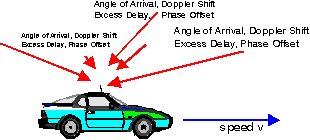 |
Each path can be described by its
Thus we can plot the received energy in a two dimensional plane, with Doppler shift on one horizontal axis and delay on the other horizontal axis.
| Environment | Delay Spread | Angle spread | Max. Doppler shift at 1800 MHz | |
| Macrocellular: Rural flat | 0.5 ms | 1 degree | 200 Hz | |
| Macrocellular: Urban | 5 ms | 20 degrees | 120 Hz | |
| Macrocellular: Hilly | 20 ms | 30 degrees | 200 Hz | |
| Microcellular: Factory, Mall | 0.3 ms | 120 degrees | 10 Hz | |
| Microcellular: Indoors, Office | 0.1 ms | 360 degrees | 2..6 Hz | |
| Table Source: A.J. Paulray and C.B. Papadias, "Space-Time Processing for Wireless Communications", Signal Processing Magazine, November 1997, pp. 49-83.
| ||||
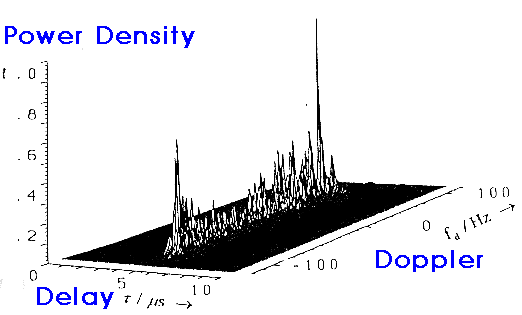
| Figure: measured scatter plot for DCS 1800 MHz system.
Doppler spread = 60.3 Hz; Coherence time = 5.9 msec. Delay Spread = 1.2 msec; coherence BW = 1.3 MHz Source: Research group of Prof. Paul Walter Baier, U. of Kaiserslautern, Germany. |
|
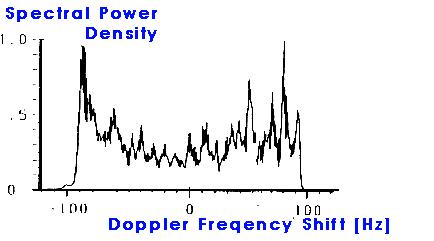
| Figure: Doppler spread corresponding to above scatter plot. Note that the Doppler spread is the projection of the scatter plot on the Doppler frequency axis. |
|
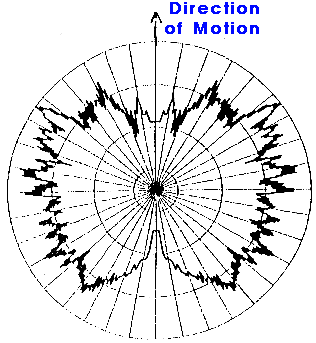
| Figure: Distribution of angle of arrival corresponding to above scatter plot. |
|
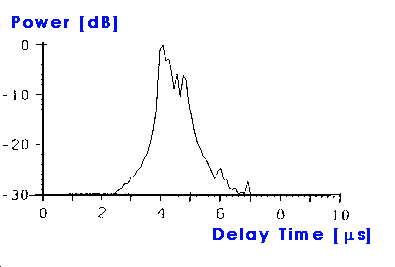
| Figure: Delay spread profile corresponding to above scatter plot. Note that the Doppler spread is the projection of the scatter plot on the time delay axis. |
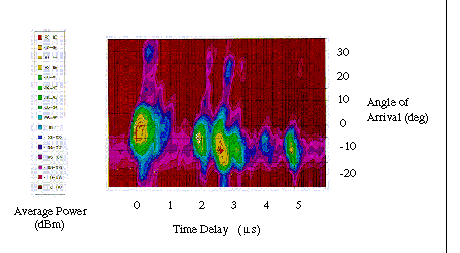
|
Received power (according to color) versus time of arrival (horizontal axis)
and angle of incidence (vertical axis).
Source credit: Nortel.
|

|
A realization of the local Power Delay-Direction Profile
(PDDP). Carrier frequency 5.2 GHz, MT
velocity 1 m/s, delay spread TRMS = 50 ns. Such a
situation is typical for a small room environment.
See the PDDP evaluation by Peter E. Leuthold and Pascal Truffer. |
            Plocal-mean      1               1           t
  p(f,t) = ------- --------------------  ---- exp(- -----)
            4 p  fm            (f-fc)2     Trms        Trms
                     sqrt( 1 - -------)
                                fm2
The integral over p(f,t) gives to total received local mean power Plocal-mean.

Figure: Scatter function. Received power per unit of
frequency shift and per unit of excess time delay.
Frequency shift normalized to the maximum Doppler shift.
Delay time normalized to the delay spread.
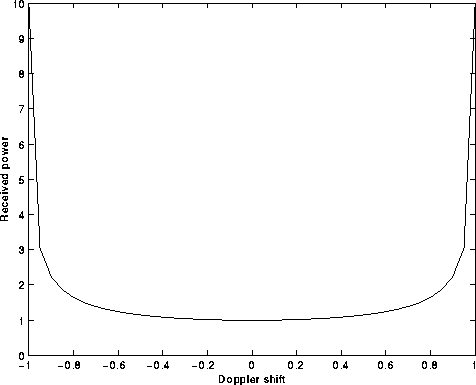
Figure: Scatter function projected to frequency axis.
This gives the Doppler spread.
Received power per unit of
frequency shift.
Frequency shift normalized to the maximum Doppler shift.
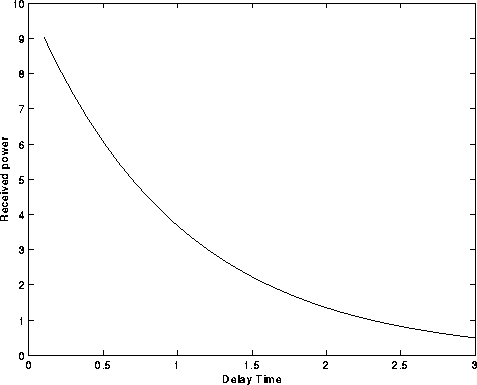
Figure: Scatter function project to delay time axis:
This gives the delay profile.
Received power per unit of
excess time delay.
Delay time normalized to the delay spread.
Channel simulations based on this theoretical model have been contributed by Ralph Haas.