
 |
JPL's Wireless Communication Reference WebsiteChapter: Analog and Digital Transmission.
Section: Multi-Carrier Modulation
|
![]()
Many channel simulation models follow the narrowband model, as for instance proposed by Jakes. Wideband channels are often simulated by extending the model assuming multiple time-delayed resolvable paths. This allows the simulation of the channel impulse response, including its stochastic behavior. To determine the performance of an multicarrier, OFDM or MC-CDMA system, another approach can be to model a set of fading subchannels. Considering a single subcarrier, the channel may be modelled as a narrowband fading channel, for instance with Rician or Rayleigh amplitude distributions. The collection of multiple subcarriers can be modelled as a set of mutually dependent fading channels. In such model, it is important to address correlation of the fading of various subchannels using the models of delay spread and coherence bandwidth.
In a Rayleigh fading channel, the received in-phase and Quadrature component are Gaussian random variables.
We describe the multi-carrier channel by the complex amplitudes of the N subcarriers, denoted as the vector of complex amplitudes H, with size N. The vector H has elements Hi, which are complex correlated amplitude variables at different subcarriers (i = 0,1, .., N-1) and can be written as:
Hi = r i exp{jfi}
The local-mean received power per subcarrier is E[ ri2/2] .
To generate the vector H in a simulation, we initially create a vectors G with i.i.d. complex Gaussian components. A complex Gaussian random variable can be generated as follows:
u1 = random(0.1)
u2 = random(0.1)
f = 2 u1
r = -2s2 ln u2
Gi = r e jf
where u1 and u2 are random numbers, uniformly
distributed on the interval [0,1] and s2 is the
variance of the random variable Gi. To simulate a system with N
subchannels, we initially create vector G as N independent random
complex amplitudes, i.e., we repeat the algorithm N times.
The vector H is jointly Gaussian with N correlated elements. To generate H a linear operation is performed on the vector G by taking:
H = A G
where A is an appropriate N by N matrix. The problem is to
find the matrix A. The vector H is random, but with known correlation
matrix of H. The correlation matrix RH of the
vector H is defined to be:
RH = E[H H*]
where H* is the conjugate transpose of H. Thus
RH = E[H H*] = E[AG (AG)*] = A E[G G*] A* = A A*
where E[GG*] is the correlation matrix of G. This matrix is an N x N unit matrix if we assume unity variance for G.
We can write the frequency separation s in terms of the subcarrier separation

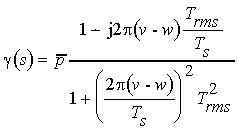
where Ts is the symbol duration and v and w are integers denoting the two frequencies. The correlation function for these two subcarriers can be written as:
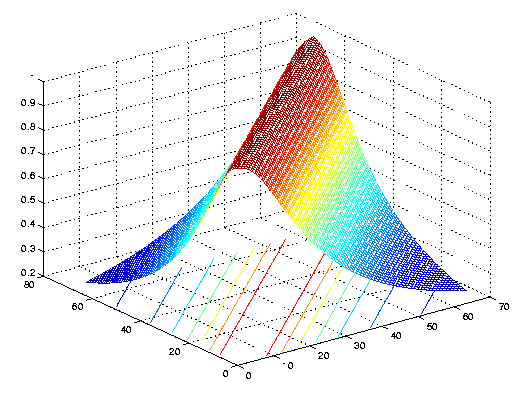 |
Absolute values of the entries in correlation matrix of the subcarrier amplitudes, RH = E[H H*]. Note that this matrix resembles a band matrix, with large entries only near the main diagonal. |
This allows us to write out the correlation matrix RH for correlation between all different subcarrier frequencies. We can find a solution for the matrix A, using RH = A A* , where the correlation matrix is given by
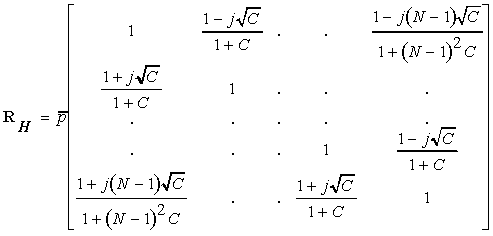
where, for ease of notation, we define

We can write the coefficients of the correlation matrix also as
![]()
with

This correlation matrix must have eigenvalues, which are real and non-negative. The characteristic polynomial, which is used to find the eigenvalues, is
![]()
where I is the identity matrix and is the eigenvalue.
If C = 0, that is for small Trms and highly correlated fading at the subcarriers, [RH(0)] = amn(0) with amn(0) = 1, that is all elements of the matrix are equal to one. This gives a matrix with N-1 eigenvalues equal to zero and one eigenvalue which equals N.
The eigenvalue is a continuous function of C. If C goes to infinity, we find a matrix with elements equal to one on the diagonal and the other elements are equal to zero, which results in:

The identity matrix I has N eigenvalues, which are all equal to one. This
occurs for large Trms.
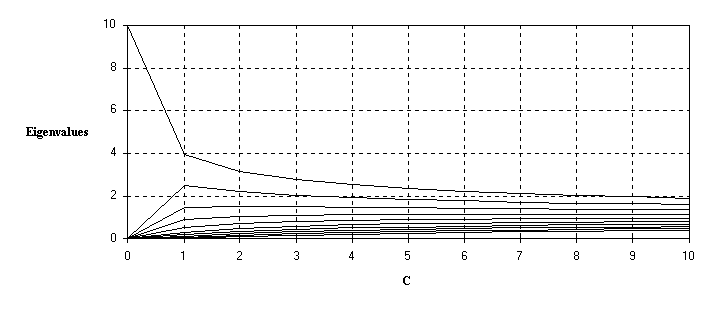
Figure: Eigenvalues versus C with N =10 subcarriers.
To determine the matrix A we will use diagonalization for the correlation matrix RH. There are two different ways to do this. One is based on an unitary transformation and the other one is based on triangular decomposition.
The eigenvectors of the correlation matrix for H can be used to construct a unitary transformation. Since the correlation matrix RH is hermitian, this means, that RH = RH* , it is always possible to find N eigenvalues d, which are all real, and N corresponding orthonormal eigenvectors ed satisfying the relation
![]()
Let ed and ef be any two eigenvectors from this orthonormal set. Then it follows that:

We define a matrix E whose columns are the eigenvectors:

It follows that
![]()
where D is the diagonal matrix of the eigenvalues, with
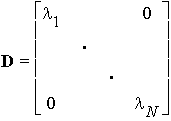
Since the columns of E are orthonormal, the matrix E* represents a unitary transformation.
If we pre- and post-multiply D by E and E*, we get:
![]()
This equation can also be written as:
![]()
From this equation we see that one possible solution for matrix A is
![]()
So the matrix A consist of the eigenvectors multiplied by the square-root of the
eigenvalues of the correlation matrix RH.
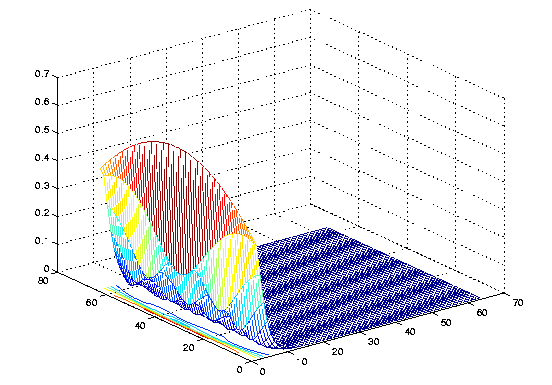 |
Absolute values of the entries in A matrix for Trms/Td
=0.01. Note that the subcarriers H (H=AG)are
created using only a few elements of G. Also: Contour plot |
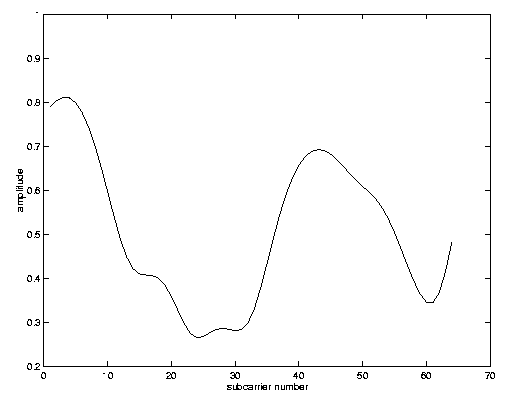
Simulated amplitudes of the channel are plotted for C = 0, C = 0.01 and C = 1.
Note that if C is increased, the fading at the different subcarriers becomes less correlated. That is, if Trms decreases or Ts increases, the channel amplitudes become more correlated. If Trms decreases then the coherence bandwidth increases also, which causes the correlation among the subcarriers.
In sample channel (a) the delay spread is equal to zero, giving flat fading, i.e., all the channel amplitudes have the same channel amplitudes.
Curve (b) addresses C = 0.01 and Curve (c) addresses C = 1. Note that if C >> 1 the assumption that subcarriers are narrowband, is violated. The resulting delay spread will be on the same order or larger than the guard time and will cause ISI.
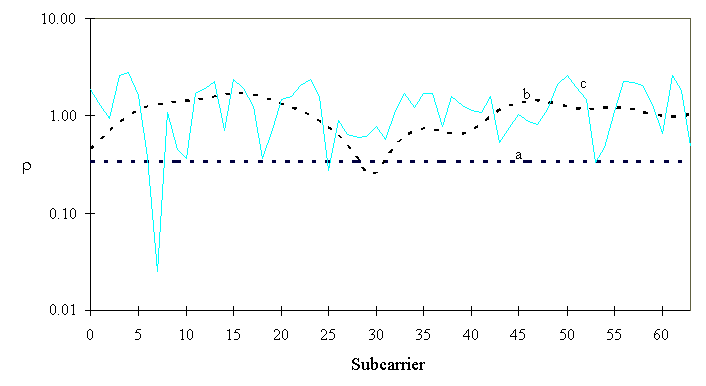
Figure: Amplitudes of dispersive and non-dispersive sample channels as function of
subcarriers with:
(a) C = 0, Trms = 0 (flat fading)
(b) C = 0.01, Trms = 0.05 Ts
(c) C= 1, Trms = Ts / 2
The following matlab code (m file) computes the complex amplitudes at nchan subcarriers. The parameter ratio is defined as the rms delay spread divided over the OFDM frame duration.
%----------------------------------------
% Multi-Carrier channel simulation
% for OFDM and OMC-CDMA systems
%----------------------------------------
nchan = 64
% number of subcarriers

ratio =  0.01;
% Td over Tb: delay spread relative to OFDM frame duration

%-----------------------------------------
% create channel correlation matrix

c     = 2 * pi * ratio;
temp  = [];
for n = 1:nchan
   nc    = (n-1) * c;
   entry = (1 + i * nc)/ ( 1 + nc^2 );
   temp  = [temp entry ];
end
Rchan = toeplitz(temp);

% Rchan is the complex channel
%       autocorrelation matrix
%----------------------------------
%
% create a complex sample channel H

 [E, L] = eig(Rchan);
 SQRTL  = sqrt(L);
 A      = E*SQRTL / sqrt(2);
 G      = randn(nchan, 1)+ i*randn(nchan, 1);
 H      = A * G;
 % plot(abs(H))