 |
JPL's Wireless Communication Reference WebsiteChapter: Wireless Channels
|
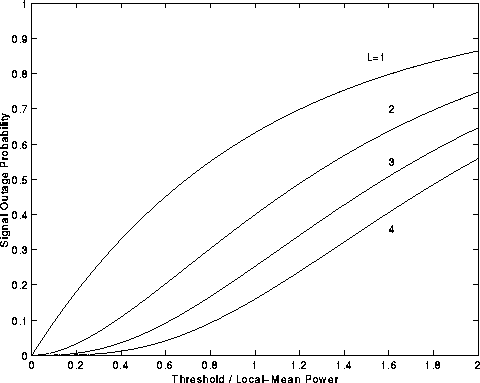
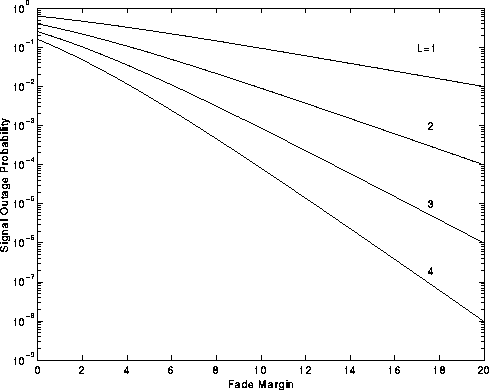
If the receiver can choose between L (L= 1,2, ..) different antennas and each antenna sees an independently fading signal, how does this improve the probability?

 Matlab Code
%-------------------------------------------

xaxis   =  [];
y1  =  [];
y2  =  [];
y3  =  [];
y4 =  [];
y5 =  [];
y97 =  [];
y6 =  [];
y95 =  [];


for k = 0:200

    x = k/100;
    prob = 1 - exp(-1* x);


    xaxis =  [xaxis, x];
    y1 = [y1, prob];
    y2 = [y2, prob2];
     y3 = [y3, prob^3];
     y4 = [y4, prob^4];


end;
%------------for k = -200:300 -----------------------


%semilogy(xaxis,y1, 'y-',xaxis, y2, 'y-.',xaxis,y3,'c+',xaxis,y4,'cx',xaxis,y5,'c*')
 plot(xaxis,y1, 'y-',xaxis,y2, 'y-',xaxis,y3, 'y-',xaxis,y4, 'y-')

axis([0 2 0 1])
xlabel('Threshold / Local-Mean Power')

text( 1.5 ,0.85,'L=1')
text( 1.6 ,0.7,'2')
text( 1.6 ,0.55,'3')
text( 1.6 ,0.36,'4')

ylabel('Signal Outage Probability')
%program end

 Matlab Code
%-------------------------------------------

%-------------------------------------------
%----------initialize counter--------------

xaxis   =  [];
y1  =  [];
y2  =  [];
y3  =  [];
y4 =  [];
y5 =  [];
y97 =  [];
y6 =  [];
y95 =  [];


for k = 0:200

    x = k/100;
    prob = 1 - exp(-1* x);
    xaxis =  [xaxis, x];
    y1 = [y1, prob];
    y2 = [y2, prob2];
     y3 = [y3, prob^3];
     y4 = [y4, prob^4];


end;
%------------for k = -200:300 -----------------------

%semilogy(xaxis,y1, 'y-',xaxis, y2, 'y-.',xaxis,y3,'c+',xaxis,y4,'cx',xaxis,y5,'c*')
 plot(xaxis,y1, 'y-',xaxis,y2, 'y-',xaxis,y3, 'y-',xaxis,y4, 'y-')

axis([0 2 0 1])
xlabel('Threshold / Local-Mean Power')

text( 1.5 ,0.85,'L=1')
text( 1.6 ,0.7,'2')
text( 1.6 ,0.55,'3')
text( 1.6 ,0.36,'4')

ylabel('Signal Outage Probability')
%program end