 |
www.WirelessCommunication.NLChapter: Wireless Channels
|

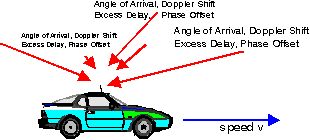
Figure: the basic idea behind the scatter functions is that it
plots the expected power per Doppler shift and per excess delay
Each path can be described by its
Thus we can plot the received energy in a two dimensional plane, with Doppler shift on one horizontal axis and delay on the other horizontal axis.
            Plocal-mean      1               1          tau
p(f, tau) = ------- --------------------  ---- exp(- -----)
            4 pi fm            (f-fc)2     Trms        Trms
                     sqrt( 1 - -------)
                                fm2
The integral over p(f, tau) gives to total received local mean power Plocal-mean.

Figure: Scatter function. Received power per unit of
frequency shift and per unit of excess time delay.
Frequency shift normalized to the maximum Doppler shift.
Delay time normalized to the delay spread.

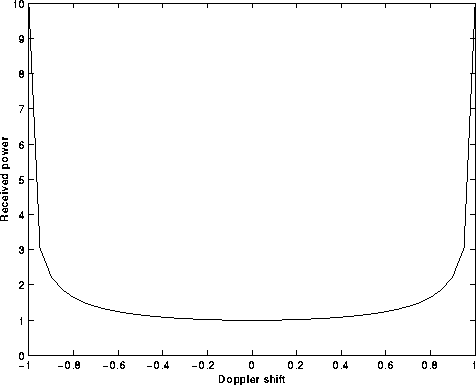
Figure: Scatter function projected to frequency axis.
This gives the Doppler spread.
Received power per unit of
frequency shift.
Frequency shift normalized to the maximum Doppler shift.

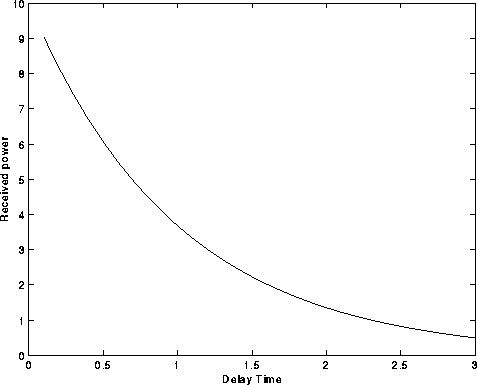
Figure: Scatter function project to delay time axis:
This gives the delay profile.
Received power per unit of
excess time delay.
Delay time normalized to the delay spread.