
Delay Spread
Because of multipath reflections, the channel impulse response of a wireless channel looks likes a series of pulses.

Figure: Example of impulse response and frequency transfer function
of a multipath channel.
We can define the local-mean
average received power with excess delay within the interval
(T, T + dt). This gives the "delay profile"
of the channel.
The delay profile determines to what extent the channel fadings at
two different frequencies
f_1 and f_2 are correlated.
Some definitions
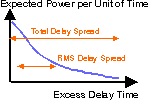
- The maximum delay time spread is the total time interval during which reflections with significant energy arrive.
- The rms delay spread T_RMS is the standard deviation (or root-mean-square) value of the delay of reflections, weighted proportional to the energy in the reflected waves.
For a digital signal with high bit rate, this dispersion is experienced as frequency selective fading and intersymbol interference (ISI). No serious ISI is likely to occur if the symbol duration is longer than, say, ten times the rms delay spread.
Typical Values
In macro-cellular mobile radio, delay spreads are mostly in the range from T_RMS is about 100 nsec to 10 microsec.
A typical delay spread of 0.25 microsec corresponds to a coherence bandwidth of about 640 kHz. Measurements made in the
U.S. indicated that delay spreads are usually less than 0.2 microsec in open areas, about 0.5 microsec in suburban areas, and about 3 micros in urban areas. Measurements in the Netherlands showed that delay spreads are relatively large in European-style suburban areas, but rarely exceed 2 microsec. However, large distant buildings such as apartment flats occasionally cause reflections with excess delays in the order of 25 microsec.
Indoor Channel
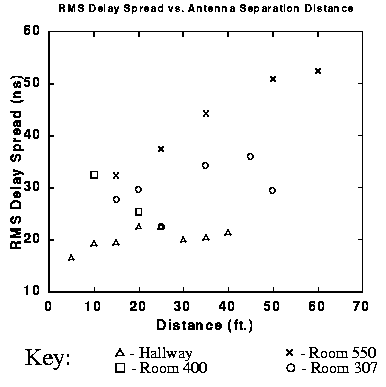
FIGURE: RMS Delay Spread vs. propagation distance
In indoor and micro-cellular channels, the delay spread is usually smaller, and rarely exceed a few hundred nanoseconds. Seidel and Rappaport reported delay spreads in four European cities of less than 8 microsec in macro-cellular channels, less than 2 microsec in micro-cellular channels, and between 50 and 300 ns in pico-cellular channels.
Delay Profile
The delay profile is the expected power
per unit of time received with a certain excess delay.
It is obtained by averaging a large set of impulse respones.
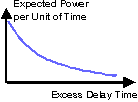
Figure: Typical delay profile: Exponential
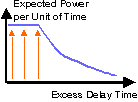
Figure: Typical indoor delay profile:
In an indoor environment, early reflections
often arrive with almost identical power. This gives a fairly flat profile up to some
point, and a tail of weaker reflections with larger excess delay.
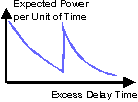
Figure: Typical "bad urban" delay profile
Besides the normal reflections from nearby obstacles,
remote high rise buildings cause strong reflections with large excess delay.
From the delay profile, one can compute the correlation of the fading
at different carrier frequencies.

Figure Auto-Covariance of the received amplitude of
two carriers transmitted with certain frequency offset.
Resolvable Paths
A wideband signal with symbol duration T_c (or a direct sequence (DS)-CDMA
signal with chip time T_c), can "resolve"
the time dispersion of the channel with an accuracy of about
T_c.
For DS-CDMA, the number of resolvable paths is
            T_delay
N  = round (-------)  + 1
             T_chip
where round(x) is the largest integer value smaller than x and T_delay is total
length of the delay profile.
A DS-CDMA Rake receiver can exploit N-fold
path diversity.
How do systems handle delay spreads?
Analog
- Adaptive channel equalization
- Channel estimation training sequence
- Use the handset only in small cells with small delay spreads
- Diversity and channel selection can help a little bit (pick a channel where late reflections are in a fade)
IS95 Cellular CDMA
- Rake receiver separately recovers signals over paths with excessive delays
- OFDM multi-carrier modulation: The radio channel is split into many narrowband (ISI-
free) subchannels


