 |
Contributed by René J. van der Vleuten
There exists an optimal retransmission backoff method for a controlled ALOHA system. It achieves maximal throughput, automatically adapts to changes in average traffic intensity or the number of active stations in the system, and applies to both pure and slotted ALOHA systems.
The essence of the method is described in the following. More details can be found in [Vleu94].
Instead of retransmitting previously collided packets with
probability Pr in each slot, a generally accepted practical retransmission strategy is
to uniformly distribute the random waiting time until retransmission, between
0 and L. This approach guarantees that a packet will be retransmitted
within a finite time. The retransmission backoff control will now optimally
adjust the value of L. When desired, Pr can be computed from L as
| Pr=2/L, | (1) |
Suppose there are N stations, each generating new packets according to a Poisson process with an average of p packets per packet time (slot). If a packet collides it will be retransmitted after an average waiting time of L/2 packet times (ignoring the round-trip delay time). The collided packet will thus generate an average retransmission traffic of 2/L packets per packet time.
Let n denote the backlog, i.e. the number of stations having a packet for retransmission, then
Recall that maximal throughput for pure ALOHA is achieved at S=1/(2e) and
G=1/2. Substituting these values into (4) gives the solution to the optimal value for L as
As shown in Theory behind the control method, the optimal value of L is determined by the value of the backlog n. Therefore, to be able to set L to its optimal value, first the backlog has to be estimated.
An estimate of the backlog, denoted by n', is obtained from (4).
Rewriting gives
n' = (G'-S) L/2, using G', an estimate of G. By
estimating n' in this way, the estimate automatically adapts to changes in
N or p, which is a very useful practical feature. Now, of course, the
estimate G' is required, but this is easily obtained by measuring the
time t during which the channel is idle. Because of the Poisson
distribution, the probability of the channel being idle during one packet
time (one slot) equals exp(-G), implying that the fraction of time during
which the channel is idle also equals exp(-G). So, if the total
duration of the
measurement is T packet times, G' is given by
| G' = -ln(t/T) = ln(T)-ln(t). | (7) |
Finally, to make the method practically applicable, a minimum and maximum value for L are used. The minimum value serves to prevent the control algorithm from reducing L to zero when both backlog and channel traffic are low, thereby preventing the backlog to suddenly increase steeply due to small fluctuations of the intensity of the offered traffic during a single control interval. On the other hand, the use of a minimum value for L implies that, under normal operation, the average delay will be slightly larger than required.
The maximum value for L prevents it from "exploding" in case of a large pulse in the traffic being offered to the system. Because the system is not in equilibrium during such a pulse, the estimated value of the backlog n' will be much higher than its true value n. A suitable maximum value for L is found by substituting n=N into (5) or (6).
In summary, during each control interval T, S and t are measured and, subsequently, G' and n' are computed. Then L is set to its optimal value, given by (5) or (6), unless L would become smaller than a certain minimum value--in which case it is set to this minimum value--or larger than a certain maximum value--in which case it is set to this maximum value.
For pure ALOHA, simulations were performed for three traffic intensities Np:
normal traffic (Np=0.02), heavy traffic (Np=0.1), and very heavy
traffic (Np=0.175), with N=5000. The minimum value of
L was set to 100 and the control interval (the time between
two subsequent adjustments of L) was set to 150 packet times. In Table 1,
the theoretical values (for L=100), as well as the performance simulation
results are listed. It can be observed that the measured values are very close to the expected values.
For slotted ALOHA, simulations were performed for heavy traffic (Np=0.2),
very heavy traffic (Np=0.35), and extremely heavy traffic (Np=0.3675),
testing the system to the limit. The theoretical and measured values are listed in Table 2.
The measured values agree very well with the theoretical ones for Np=0.2
and Np=0.35. For Np=0.3675 the
agreement is still quite good.
| ||||||||||||||||||||||||||||||||||||||||||
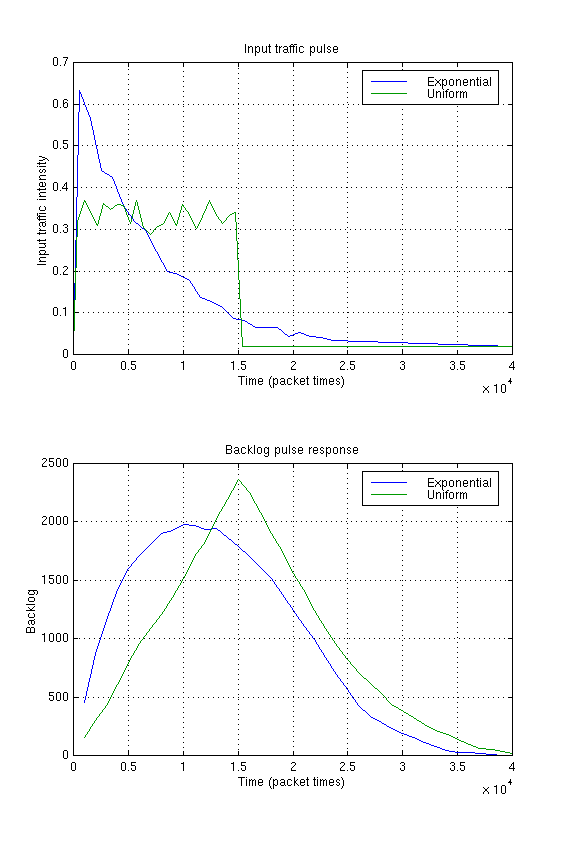
In order to demonstrate the dynamic stability of the control algorithm,
traffic overload pulse response simulations were carried out for pure ALOHA
using two different input traffic pulse shapes:
exponential and uniform. The pulses are formed as the sum of the packets
generated by the individual stations, which each send a packet after
waiting for an average of 7500 packet times from the
beginning of the pulse. For both simulations, Np under normal
conditions was set to 0.02, the minimum value
for L was set to
100, the maximum value to 32 000, and the control
interval was 150 packet times.
The input pulses and the resulting backlog waveforms are shown in
Figure 1.
The simulations of traffic overload pulse response show that the system
remains stable in an overload situation.