
PDF of received signal amplitude
In order to obtain the probability density function
(PDF) of the signal amplitude  of a Rayleigh fading signal, we observe the random processes of the inphase and Quadrature components, I(t) and Q(t) , respectively, at one particular instant t_0. If N becomes very large and are i.i.d., the central limit theorem says that I(t_0) and Q(t_0) are (zero-mean) Gaussian. The received signal

has a Rayleigh amplitude
 , with
 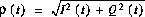 and a uniform phase
  between 0 and 2 pi. The pdf of the amplitude is
where  is the variance of I(t) and Q(t).
 Exercise
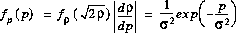
Let z = x + jy with x and y i.i.d. Gaussian with zero mean and variance  . Show that
  is Rayleigh distributed, with

and
 .
.
Simulations have shown that the Rayleigh pdf appropriately describes the fading of the amplitude if N is larger than 6. Measurements over non-line-of-sight paths at UHF frequencies in urban environments confirmed the accuracy of the Rayleigh pdf.
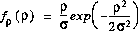
The instantaneous power p, with  , thus, averaged over one RF-cycle, has the exponential pdf
where sigma^2
is the local-mean power.
Exercise
Find the cumulative distribution of the received power. In a cellular voice channel, a signal outage occurs if the instantaneous signal-to-noise ratio is less than z = 10 (10 dB). Find the required local-mean power to ensure an outage probability of less than 1%. Find the corresponding fade margin, defined as the excess power above the threshold z N with N the noise power.
Exercise
write a computer program that plots the probability that a Rayleigh fading signal drops below a certain threshold. Show that the curve can be plotted as a
function of a fade margin, i.e., the ratio between the local mean power
and the threshold.
If the receiver can choose between L (L= 1,2, ..)
different antennas and each antenna sees an independently fading signal, how does this improve the probability? (Hint: see diversity)
Solution.
If the set of reflected waves are dominated by one strong component, Rician fading is a more appropriate model.


